Total nº. of incidents
Source OSCE
Figure 9: Map Europe with total number of hate incidents per country according to Official Data
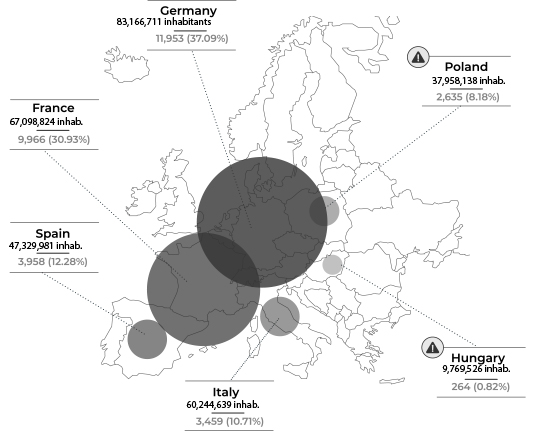
Table 7: Yearly evolution of hate crime incidents by country. Official Data
| PAÍS | TOTAL | Total (%) | 2015 | 2016 | 2017 | 2018 |
|---|---|---|---|---|---|---|
| Alemania | 11.953 | 37,09% | 3.063 | 3.598 | 2.576 | 2.716 |
| España | 3.958 | 12,28% | 1.003 | 1.005 | 962 | 988 |
| Francia | 9.966 | 30,93% | 1.790 | 1.835 | 1.911 | 4.430 |
| Hungria* | 264 | 0,82% | -- | -- | 70 | 194 |
| Italia | 3.450 | 10,71% | 555 | 736 | 1.048 | 1.111 |
| Polonia* | 2.635 | 8,18% | 263 | 941 | 927 | 504 |
| TOTAL | 32.226 | -- | 6.674 20,71% | 8.115 25,18% | 7.494 23,25% | 9.943 30,85% |
![]() Severe data deficit on hate crimes in Poland and Hungary due to a lack of monitoring and observatories.
Severe data deficit on hate crimes in Poland and Hungary due to a lack of monitoring and observatories.
Hate crimes by type of motivation
Figure 10: Crimes by type of motivation and country. Official Data.
| TOTAL 994 | GERMANY 11.953 | SPAIN 3.958 | FRANCE 9.966 | HUNGARY 264 | ITALY 3.450 | POLAND 2.635 |
|
|---|---|---|---|---|---|---|---|
 | Racism and xenophobia | ||||||
| 58,58% | 1.976 | 3.729 | 52 | 2492 | 1523 | ||
 | Anti-Semitism | ||||||
| 9,27% | 917 | 31 | 1.614 | 428 | |||
 | Crimes against sexual orientation | ||||||
| 9,00% | 456 | 929 | 1.263 | 246 | 24 | ||
 | Islamophobia | ||||||
| 4,56% | 509 | 576 | 385 | ||||
 | Sexual crimes | ||||||
| 3,06% | 147 | 840 | 2 | ||||
 | Persons with disabilities | ||||||
| 2,28% | 25 | 538 | 712 | ||||
 | Non-specified | ||||||
| 0,75% | 48 | 194 | |||||
 | Anti-Gypsyism | ||||||
| 0,60% | 18 | 178 | |||||
 | Anti-Christianism and other religions | ||||||
| 0,10% | 920 | 289 | 1.944 | 18 | 95 |
| TOTAL 994 | GERMANY 11.953 | SPAIN 3.958 | FRANCE 9.966 | HUNGARY 264 | ITALY 3.450 | POLAND 2.635 |
|
|---|---|---|---|---|---|---|---|
| Racism and xenophobia | ||||||
| 58,58% | 1.976 | 3.729 | 52 | 2492 | 1523 | ||
| Anti-Semitism | ||||||
| 9,27% | 917 | 31 | 1.614 | 428 | |||
| Crimes against sexual orientation | ||||||
| 9,00% | 456 | 929 | 1.263 | 246 | 24 | ||
| Islamophobia | ||||||
| 4,56% | 509 | 576 | 385 | ||||
| Sexual crimes | ||||||
| 3,06% | 147 | 840 | 2 | ||||
| Persons with disabilities | ||||||
| 2,28% | 25 | 538 | 712 | ||||
| Non-specified | ||||||
| 0,75% | 48 | 194 | |||||
| Anti-Gypsyism | ||||||
| 0,60% | 18 | 178 | |||||
| Anti-Christianism and other religions | ||||||
| 0,10% | 920 | 289 | 1.944 | 18 | 95 |
OWN DATA
Identified victims
Official data
Victims of incidents resulting in death (includes injured)
Civil society data
Mortal victims
Graph 11: Year-on-year evolution of hate incidents according to official figures, 2015-2018
Official data
TOTAL 32.226

58%
crimes of racism and xenophobia
Cronology
Gráfico 12: Evolución anual de incidentes de odio según DatosSociedad Civil,2015-junio 2020
Civil Society Data
TOTAL 5.990

225
acts of double motivation

25%
de los actos de odio son agresiones violentas
Cronology
*Organisations recognised by OSCE
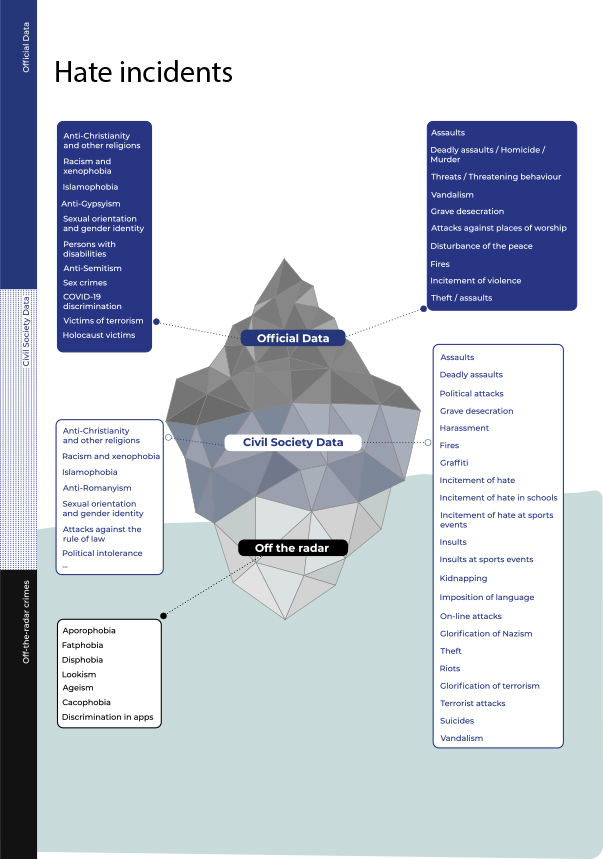
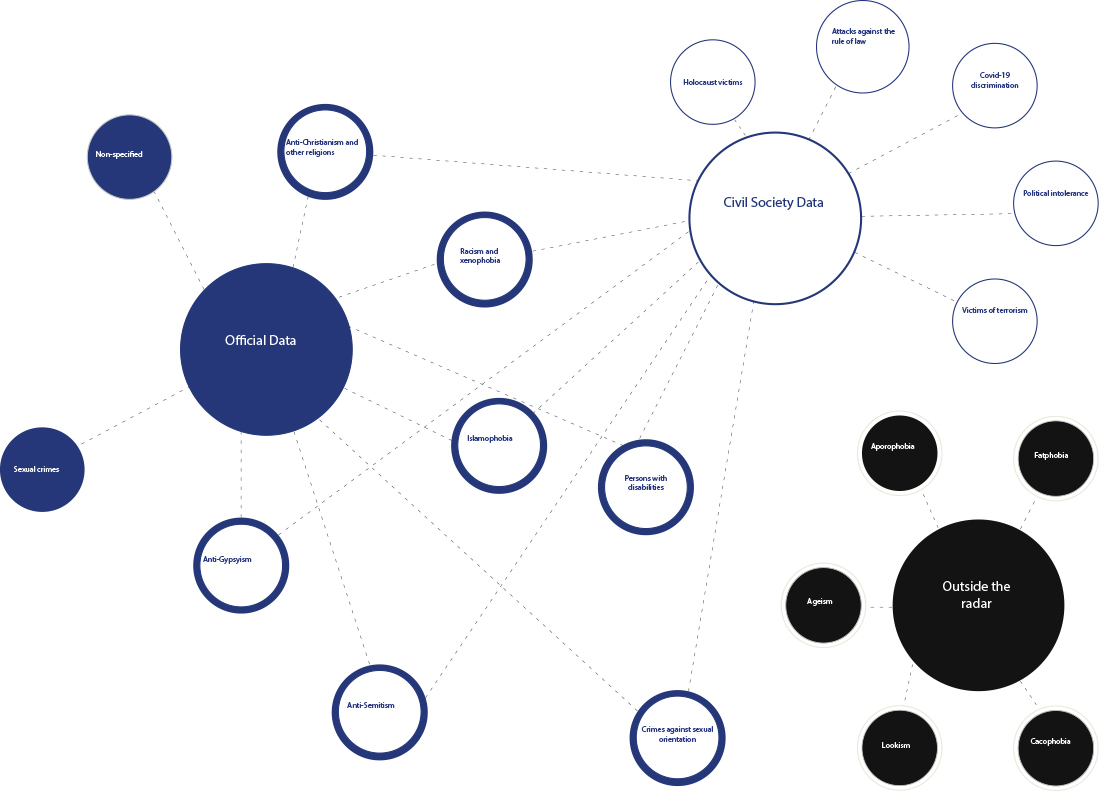
Official Data
Civil Society Data
Off-the-radar
In memorariam:
We have tried to bring the victims out of their anonymity as a matter of dignity. This was not possible for everyone, but we have sought as much information as possible (name, age, locality, motive, type of aggression and illustrative data on the story).
Determining the exact motive behind this type of homicide involves psychological and legal analysis of each case. Data collection from newspapers and other open sources multiplies the motive to be considered.
We set up a classification system based on the motives mentioned in our sources, considering that this affected the outcome, although in no case does it make any absolute or exclusive suppositions.
Fitting the psychological and philosophical reality of hate into statistical and mathematical parameters requires an in-depth multidisciplinary analysis, so these classifications will be revised in the future.
Fitting the psychological and philosophical reality of hate into statistical and mathematical parameters requires an in-depth multidisciplinary analysis, so that these classifications can be further studied in the future.
According to the victims identified, racism and xenophobia are the factors that have caused most deaths (26), followed by homophobia (21) and anti-Christianism (9).
In the cases where the perpetrators are known, Christians are considered “infidels” except for one case, an intolerant and fundamentalist secularist who considers believers to be worthy of death.